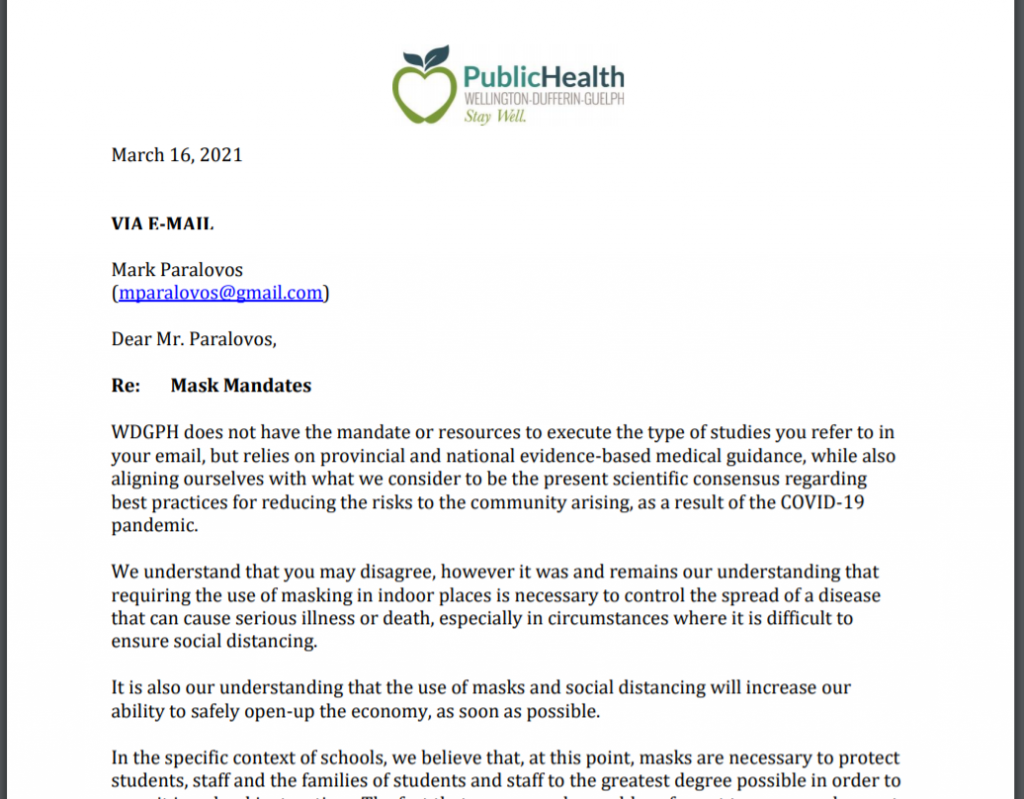
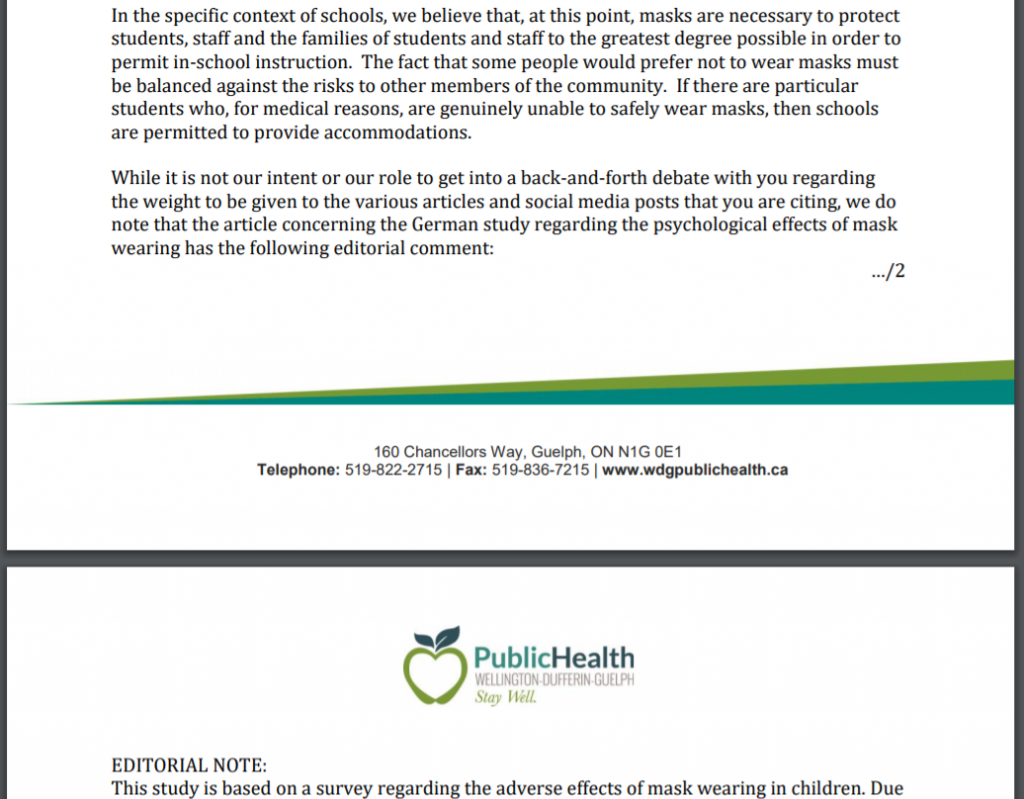
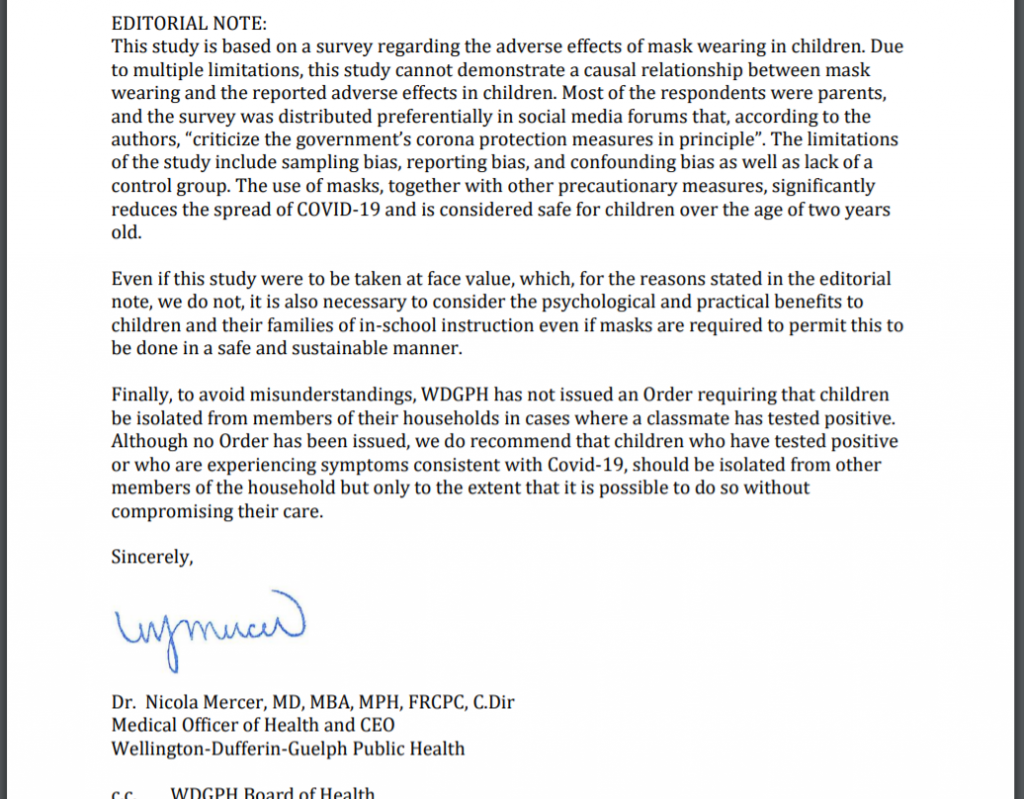
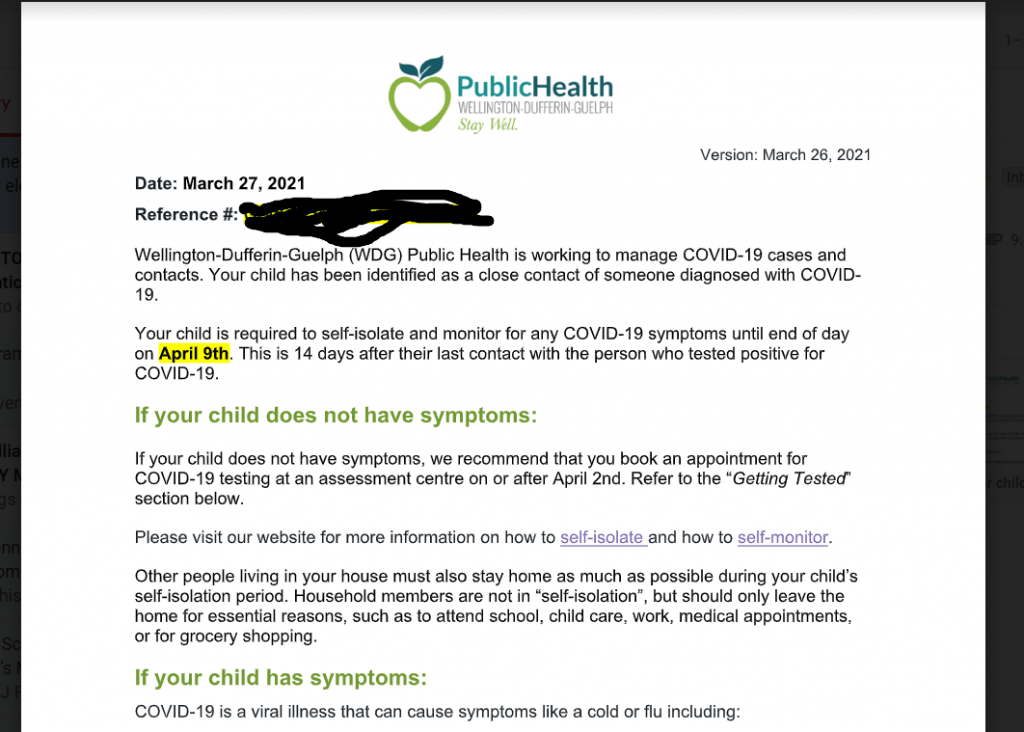
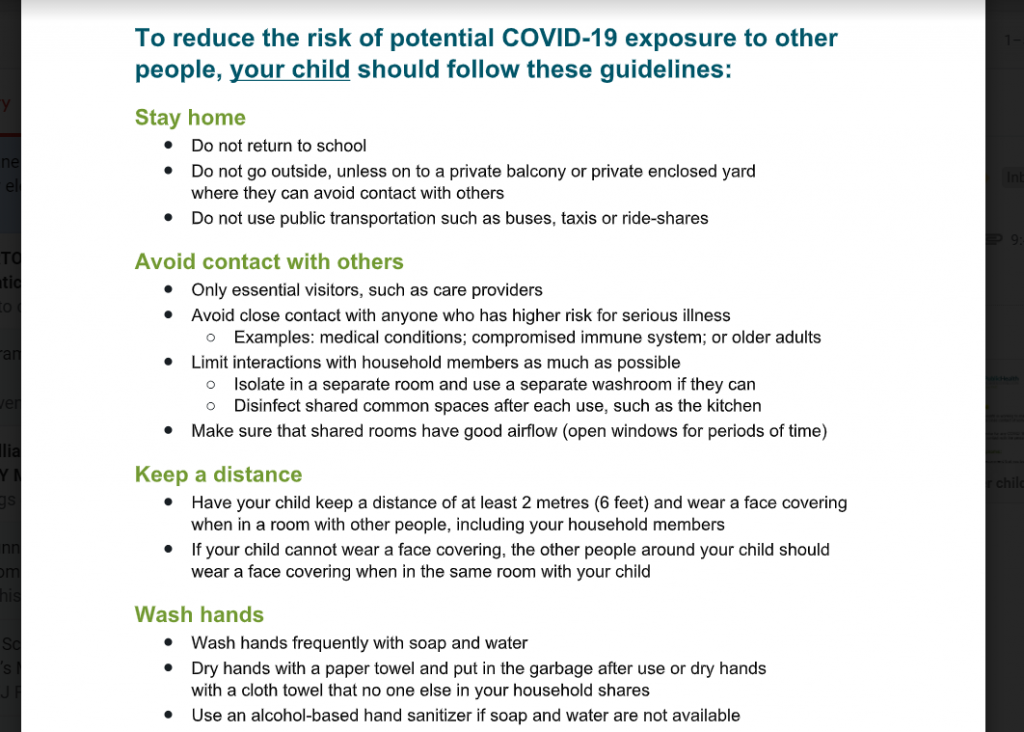
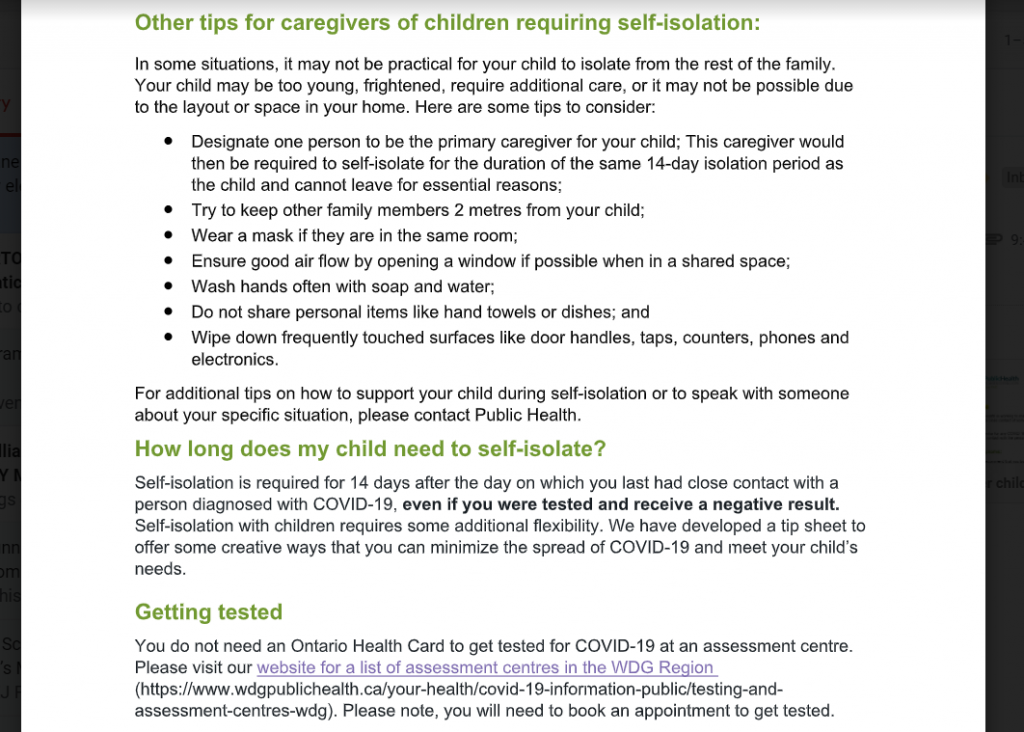
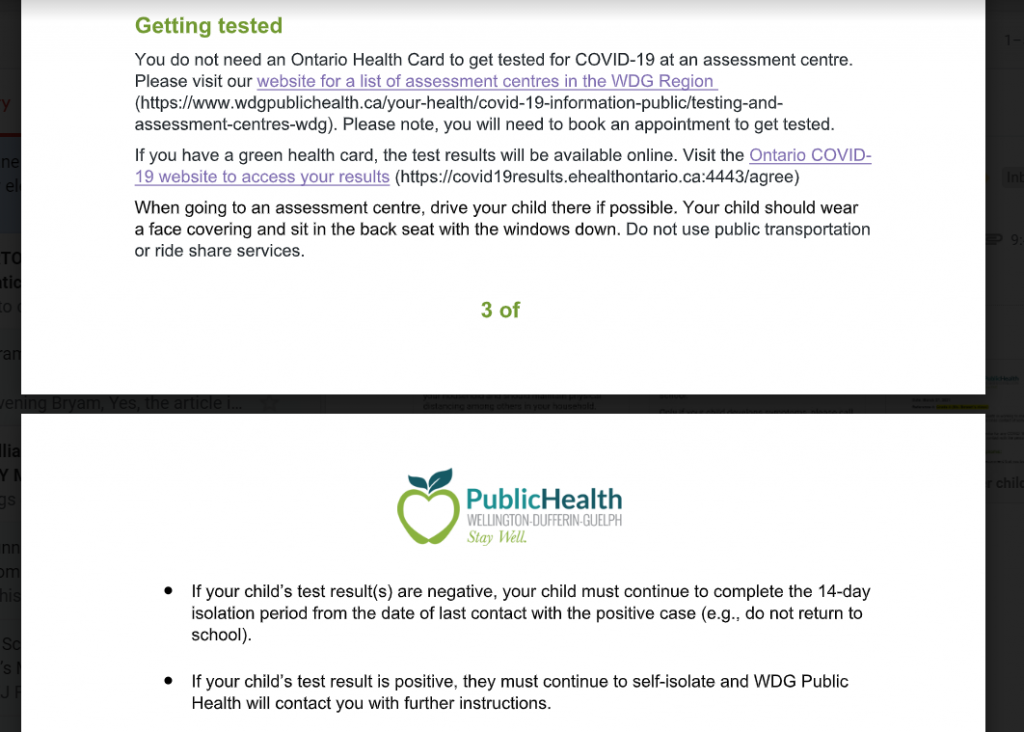
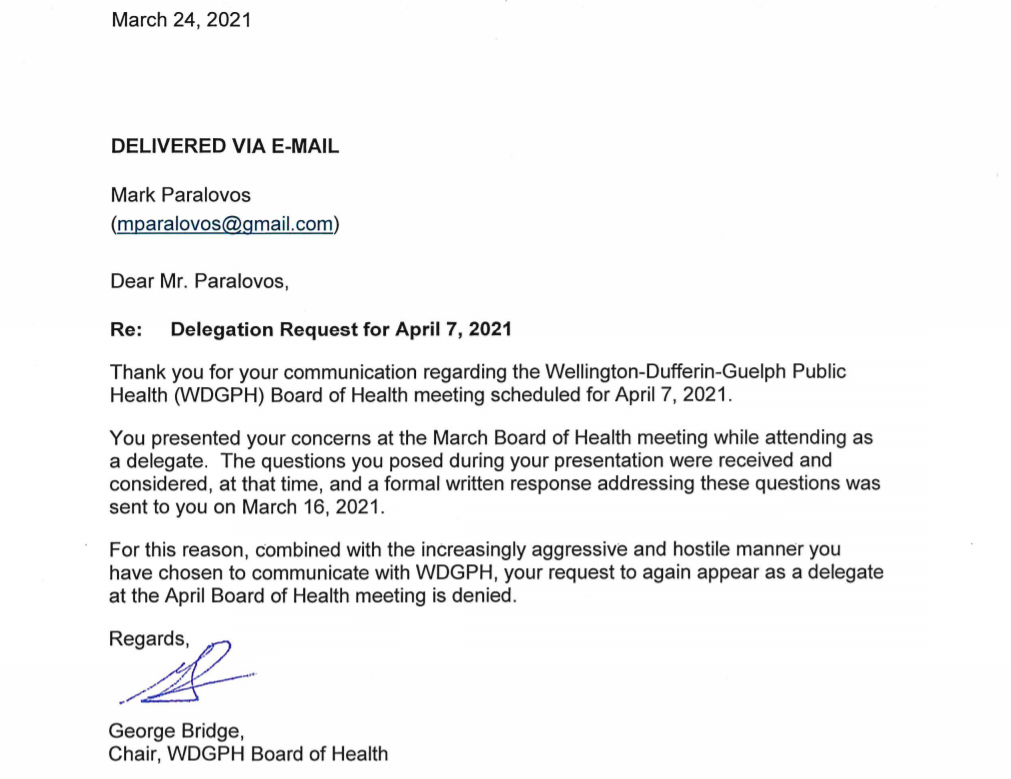
Download the original letter in PDF (which includes the graphics in the correct spots)
To the WDG Public Health Board, I would like to be a delegate at your next meeting. I would like to discuss mandatory masking of children in schools. Specifically, expansion of masking mandates and increased rules around mandatory masking. I would also like to understand exactly what metrics we are using to measure our lockdowns. Here is a news article with Dr. Mercer advising the UGDSB trustees of best practices regarding masking. https://www.cbc.ca/news/canada/kitchener-waterloo/ugdsb-masks-required-covid-19-1.5691742
First and perhaps most importantly, has there been an impact study of masking vs no masks on children? Who completed it and where can we read it? Any cost benefit analysis that has an accurate assessment of potential drawbacks of mandatory masks, including physical, psychological, developmental as well as defined outcome metrics / expectations (what you expected vs what actually happened)? If not, how can we possibly continue to experiment with our children like this? If so, where can I read it?
What did the study identify as potential health impacts, developmental impacts and any other potential drawbacks to masking children for prolonged periods? How many 6 year olds were studied, how long were they forced to wear a mask for per day and what were their outcomes? How many 8 year olds? How many 12 year olds in the studies? Isn’t informed consent a necessary part of any medical intervention? Why are we not informed of the potential drawbacks of mandating masks on children? Nearly a year in!
There is a large body of policy-level evidence that backs up the idea that wearing a mask when healthy is not beneficial. There is also evidence that non-pharmaceutical interventions (NPI’s) 2 like lockdowns, masking and physical distancing do not meaningfully change case numbers, death numbers or infection numbers. I will go through a small sample of that evidence now.
In 2015 and 2018, the Ontario Nurses Association successfully argued that the “Vaccine or Mask” (VOM) policy violated the nurses basic rights and is “illogical and makes no sense” and “is the exact opposite of being reasonable.”
https://www.ona.org/news-posts/ona-wins-vaccinate-or-mask-flu-policy/
In 2015 this is what the arbitrator said:
3 https://www.cbc.ca/news/canada/toronto/union-says-ontario-nurses-can-t-be-forced-to-wear-ma sks-in-flu-season-1.3222702
In light of this expert’s opinion, which was echoed by the WHO at the beginning of the pandemic in 2020 (https://twitter.com/WHOWPRO/status/1243171683067777024?s=20), can you outline in detail (with links to the information) what has changed about mask efficacy? What the WHO said: “If you do not have any respiratory symptoms, such as fever, cough, or runny nose, you do not need to wear a medical mask. When used alone, masks can give you a false feeling of protection and can even be a source of infection when not used correctly.” https://bit.ly/2QN3QOp Here is one recent study from Germany that has looked at mandatory masking of 25,000 students and the negative impacts of that mandatory masking. The impacts are significant, as illustrated here (3rd paragraph):
4 https://www.independent.co.uk/news/german-children-suffer-from-psychological-issues-in-pand emic-children-children-researchers-families-children-b1800396.html?utm_content=Echobox&ut m_medium=Social&utm_source=Twitter#Echobox=1612980377
https://www.researchsquare.com/article/rs-124394/v2 https://montanadailygazette.com/2021/01/25/new-study-finds-masks-hurt-schoolchildren-ph ysically-psychologically-and-behaviorally/ Here is the original study: 5
https://www.researchsquare.com/article/rs-124394/v1
And here is a registry that is being used in the United States. You can read the negative impact of masking from first hand accounts of parents who have no options. https://nomasksforkids.com/
6 Sweden has banned masking and PPE from schools and even demanded teachers remove masks: https://sverigesradio.se/artikel/halmstad-forbjuder-munskydd-i-skolan A student was suspended from a school in Guelph for removing their mask for a breathing break.
https://twitter.com/Whitney46535074/status/1362731274633379842
7 Guelph has had mandatory masks in place since July 2020, but it has not averted multiple lockdowns. Nor has it prevented outbreaks in Long Term Care homes, places of employment etc.
If you are convinced that masking reduces the spread by a percentage amount, do you have anything other than models to back up your claim?
What is the percentage amount that infection was reduced due to masking in Guelph, according to your data? Please share everything you have showing this, including source data, name and date as well as output of model and modeling inputs. The issue is that we have examples of places that did not have the same restrictions as we did, and it appears that they did not have a worse outcome.
That data shows that the NPI’s used did not impact the curves. Most “curves” look the same regardless of NPI’s in place. To be clear, this means that the argument of “it would have been worse without the masks” is null. That is NOT seen in the actual data of places that did not mandate masks. Here is a graph that shows when mandatory masks were started and further lockdown measures attempted. It had no effect on the curve. (you can see a larger version at the link)
https://twitter.com/Milhouse_Van_Ho/status/1346325686496194560?s=20
Source: https://covid-19.ontario.ca/data
The yellow notes on the graph say: July 7 – Mandatory Masks, Oct 10 ban on indoor dining, Nov 14: Totonto 2nd lockdown
8 Are we to believe that the lockdown that started in Toronto in October is only now starting to take effect? Are we to ignore seasonality completely as well? We have data from Sweden, Florida and multiple states with similar populations to Ontario and we have seen that masks make little difference in the respective curves. In fact, globally it looks a lot like a yearly seasonal curve to quite a lot of people.
Here is that data: Florida, Georgia and South Carolina have been Open since April, Sept and Oct. They have a ranking by state of deaths per million. Florida is 26th, Georgia is 23 and South Carolina is 20th. No mass death is equated with 3 large populations that have no mask mandates in place.
https://twitter.com/jeffreyatucker/status/1359144860935159813?s=20 https://www.worldometers.info/coronavirus/country/us/
Multiple states on one graph: Source cited by graphs:
https://covidtracking.com/ https://twitter.com/ianmSC/status/1360319669635190787?s=20 9
Mississippi and Alabama:
10
https://twitter.com/ianmSC/status/1358149572250505224?s=20 https://twitter.com/ianmSC/status/1360323405099061248 11
Idaho and Utah – Utah had a mask mandate, Idaho did not: https://twitter.com/ianmSC/status/1360396841372721153 12 13 https://twitter.com/ShrubberyBanana/status/1360404241458688000?s=20
Seasonality curve around the world:
https://twitter.com/ClareCraigPath/status/1356539867530936321?s=20 14 15
Here is Germany 2020 vs Flu 2018
https://twitter.com/DaFeid/status/1294393266654318592
Florida – Fully open since September 2020 https://www.google.com/search?q=covid+graph+for+florida&oq=covid+graph+for+florida&aqs=c hrome..69i57j0i22i30l2j0i390l2.2826j0j1&sourceid=chrome&ie=UTF-8 16 17
Sweden – Never Closed https://www.google.com/search?q=covid+graph+for+sweden&oq=covid+graph+for+sweden&aq s=chrome..69i57j0i390l2.4401j0j1&sourceid=chrome&ie=UTF-8 18 19 Ontario –
Full lockdown, eased restrictions in the summer then ineffective lockdowns https://www.google.com/search?q=covid+graph+for+ontario&oq=covid+graph+for+ontario&aqs= chrome..69i57j0i390l4.3378j0j1&sourceid=chrome&ie=UTF-8 20
Florida has more than double the cases of Ontario, and yet their economy is open and they are not reporting mass death or casualties from Covid19. Why is that? Do you have a good explanation why these curves look similar to the seasonal curves noted around the world? When the data shows that mandatory masking in Ontario starting in July didn’t meaningfully stop the case numbers from getting to the point of needing new lockdowns in the fall and winter, and the evidence of no overwhelmed hospitals and no mass deaths from places that are fully open, would it not be reasonable to reassess our strategy?
If we have had a failing strategy for a year, with dire financial, economic and cultural impacts then that failure should be addressed. Our strategy must be adjusted with the data! In BC wearing a mask is left up to the family with regard to wearing during school. Why are there different rules for different health units? How can these policies possibly be science driven? What science (not provincial order, what SCIENCE) is currently driving the mandatory masking in our health unit? If it were accepted science wouldn’t everyone adopt the same measures? Further, the measures that have been adopted don’t seem to be successful at the goal of “reducing the impact” of the virus. I say that, because I can’t find the specific goals of the lockdown other than some vague statements from different levels of leadership. How are we to measure our success without any meaningful metrics and with constantly shifting goalposts? Can you clearly articulate the goal of the previous most recent lockdown?
https://twitter.com/Milhouse_Van_Ho/status/1359564556192927749?s=20 https://www.tricitynews.com/local-news/what-you-need-to-know-about-bcs-new-mandatorymask-rules-at-schools-3355357
In light of the new data, based on real world observations and not models, and pending questions about efficacy of masks (do they work to stop the spread of respiratory virus? How is their success measured? Does the protection offered outweigh the potential harms? What are those harms?), the mandatory masking of children in schools should be stopped immediately pending review of the impacts and informed consent of the guardians who have to comply with these masking standards. Informed consent is not possible at this time as no one has been briefed on the potential drawbacks of prolonged masking of children. Speaking of clear metrics, what metrics are we using to lock down our businesses and economy?
On Dec 28th we had 6 people in the hospital and 163 cases per 100k. That was the beginning of a 45 day lockdown. The hospitalizations have not changed over that period of time. We have consistently had between 3 – 10 people in hospital, but mostly between 4-6 people. During that time the occupancy has been below the 5 year average, staying below 90% and getting as low as 75.2%. Test positivity rate fluctuates as well from 3.6 at the beginning of the lockdown to 5.9% 12 days into the lockdown started on December 26. It sat at 4.2-4.4% until Feb 1 and then it started declining. You can see every day from our public health stats to illustrate my point, but here are the 3 days in question. Dec 28 and Feb 11 and Feb 17.
How is it decided to put Guelph into Red level? What metrics are driving the decision? What criteria do we need to achieve to get to Yellow level as it seems the colour coded system isn’t being arbitrarily followed. How can we run a society with ever changing rules, decided upon by a single, unelected bureaucrat? 22 https://canadareport.co/guelph-2020-lockdown-2/
Here are the criteria for the colour coded system that was in place prior to the Dec 26th lockdown. https://toronto.ctvnews.ca/here-s-how-ontario-s-colour-coded-covid-19-system-works-1.5172308
As you can see, the only metrics that puts us in the Red – Control group are cases per 100k and test positivity. As of Feb 17 we were at 39 cases per 100k. Case numbers clearly don’t tell the whole story, but case numbers are falling, hospitalizations are steady. Help me understand what metrics are driving the continued economic misery in our city. Why don’t we have a clear understanding of how this process operates and how restrictions are decided upon?
Similarly can you give me a number for 2015 – 2020 for pneumonia deaths in Guelph for January – March so we can compare the deaths in this January – March timeline? Is 20 deaths normal for this time of year in a typical flu season? Despite the numbers demonstrating quite well over the last 45 days that case numbers do not impact hospitalization numbers (case numbers doubled during the lockdown, while hospitalizations were stable) we have endured more than 45 days of lockdown and economic misery (of a stated 28 days), for what gain? Can you clearly demonstrate what has been accomplished with these damaging policies?
Who can the public hold accountable? This situation has not come about because of a virus. It has come about because of bad policies. We have examples of other places in the world that have not suffered nearly as much because their leadership refused to implement lockdowns and other failed policies. Here is a recent one from Florida. https://twitter.com/GovRonDeSantis/status/1360616518434910208?s=20
I will be publishing this as a public letter. Looking forward to addressing the board in March.
Thank you for your time. Mark Paralovos
P.S. Often, as with a snow storm, dire predictions can end up being very wrong. Here is a good example with covid.
The 4th surge never came. (image on next page, along with some supplemental reading): https://twitter.com/ianmSC/status/1360319669635190787?s=20 29 Some further reading:
The Milgram Experiment
https://en.wikipedia.org/wiki/Milgram_experiment
In this experiment a person in authority (like public health) tells a subject (who is being measured for compliance to authority) to administer an electric shock to an unseen person on 30 the other end of a speaker. The subject is instructed by the person in authority to continue administering the electric shocks periodically after the “volunteer” gets a question wrong. These are recorded responses, and they plead with the subject to stop shocking them.
The experiment continues until the “volunteer” stops responding (after saying that they have a heart condition and that they can’t take it anymore). You can watch a video of a documentary on it here: https://youtu.be/rdrKCilEhC0?t=426 This parallels very well to masking our children. Parents are being told by people in authority to mask their children. Parents are being told masking is good for the children while not being told of potential drawbacks, even though we know there are potential drawbacks! What the Milgram experiment shows is that people will inflict harm on other people if told to do so by a person in authority.
You are that authority in this case. Another well known experiment regarding the developmental side of child / caregiver interactions: This is what happens to infants who have emotional displays removed from their interactions.
I hope you read this. still face experiment
https://www.gottman.com/blog/research-still-face-experiment/
Here is a thread outlining the flawed conclusions of the 2020 mask “Studies.” https://twitter.com/IAmTheActualET/status/1350212693190455298?s=20
Here is a visual demonstration of why masks do not impede any kind of vapor. We just can’t see it. https://twitter.com/TonyRogers1256/status/1357111815671545856
A further study on the covid restrictions in Ontario 31 https://ocla.ca/wp-content/uploads/2021/02/OCLA-Report-2021-1-4th-science-review-for-covid-p olicy-Reg-364-20-7f.pdf May 2020 –
Masks not always the answer https://www.cbc.ca/news/canada/new-brunswick/nb-wearing-masks-1.5560578 impact of masks in UK https://twitter.com/Stat_O_Guy/status/1359148708475113475?s=20
I would ask why we’re not pursuing therapeutics, but that will wait until I can address you in April, I suppose. treatment https://twitter.com/DrP_MD/status/1361859838029017089?s=20 Early treatment https://twitter.com/robinmonotti/status/1362038625333088258
